Radial Voronoi diagram experiments in JavaScript
Voronoi diagrams are a way of partitioning (splitting up) space into perfectly balanced “cells” based on the positions of “seed” points. Formally these cells are defined as regions in which every point inside the cell is closer to that cell’s seed point than it is to any other seed point. These diagrams are remarkably useful for modeling organic phenomena in a wide range of fields including biology, chemistry, astrophysics, geography, and much more.
Personally, I am fascinated with the striking similarities between Voronoi diagrams and real-world organic phenomena, especially at the microscopic scale. In particular, I’m deeply interested in the extreme variety of radially-symmetric forms found in diatoms and radiolaria, which are theorized to be created partly through the close packing behaviors of so-called “soft bodies” (like air bubbles and water droplets) and microscopic forces like surface tension and electromagnetic attraction/repulsion.
To explore the relationship between Voronoi diagrams and organic systems, I created the following set of experiments, which are available for free online here:
To give credit where credit is due, my initial spark of inspiration for this method came from Mario Klingemann’s (quasimondo) 2012 series Ornaments in a Box.
Experiments
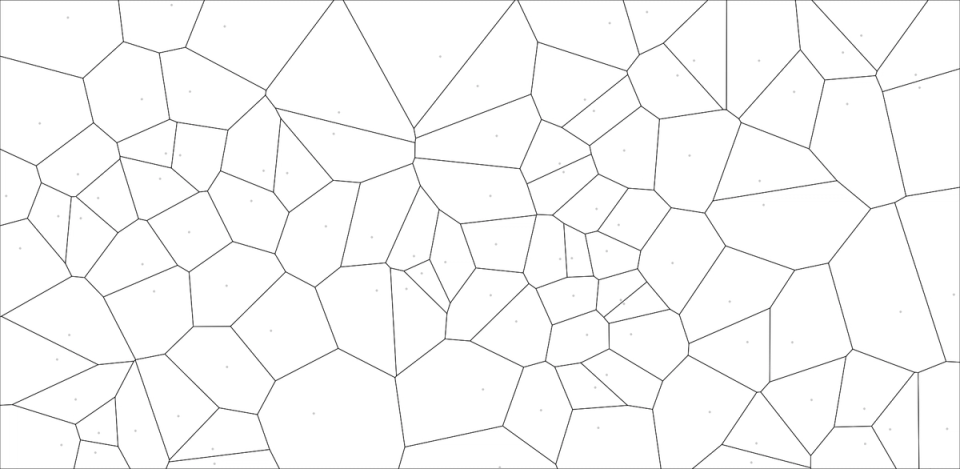
First I set up the simplest sketch I could think of so I could work out the packages and workflow to use in all the experiments. I ended up using a mix of p5.js and native ES6 JavaScript for all of the canvas drawing functionality and logic, which gets bundled, transpiled, and served using Webpack and NPM scripts. For the Voronoi diagrams, I tried a few different packages but eventually settled on d3-delaunay for its ease-of-use and compatibility with my setup.
To test that the setup worked as expected, I generated a set of random seed points and ended up with this:
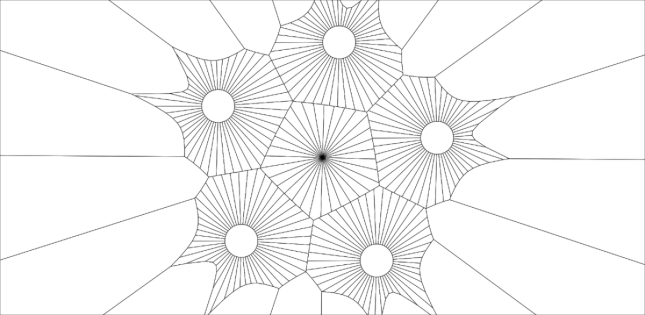
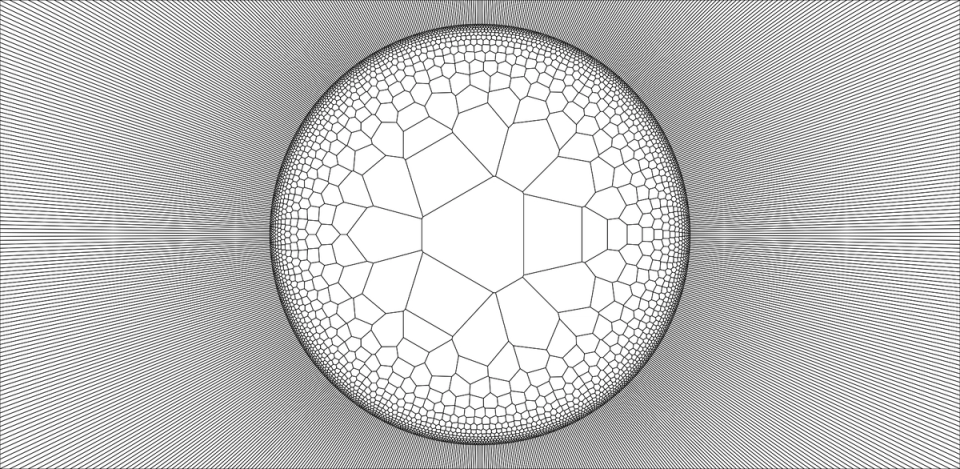
To start creating forms that resemble diatoms and radiolaria, I started generating seed points along concentric circles, all centered on the screen:
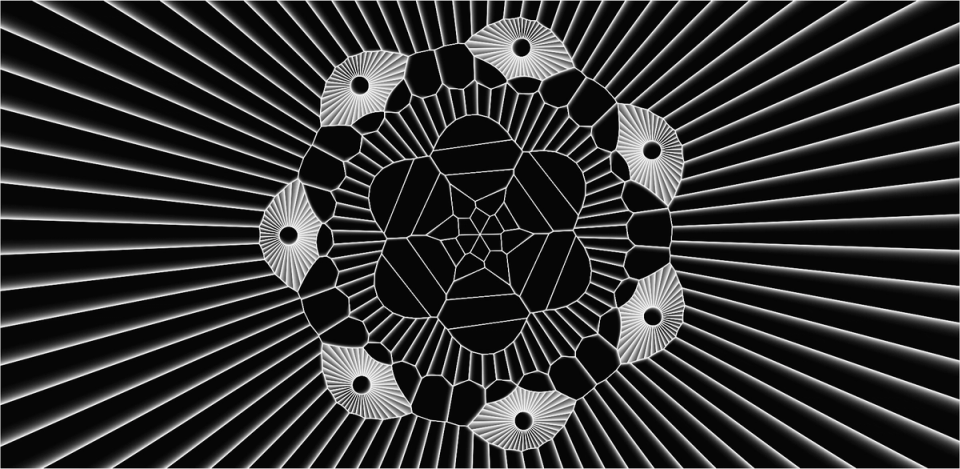
Next, borrowing a technique from Mario Klingemann’s Ornaments in a Box series, I started experimenting with adding “sub-rings” around certain seed points. In other words, rings of seed points centered on seed points from larger rings:
Given that every ring (and sub-ring) of seed points is generated procedurally with a semi-randomized diameter and rotation, those parameters could be modified over time to produce stunning animations like so:
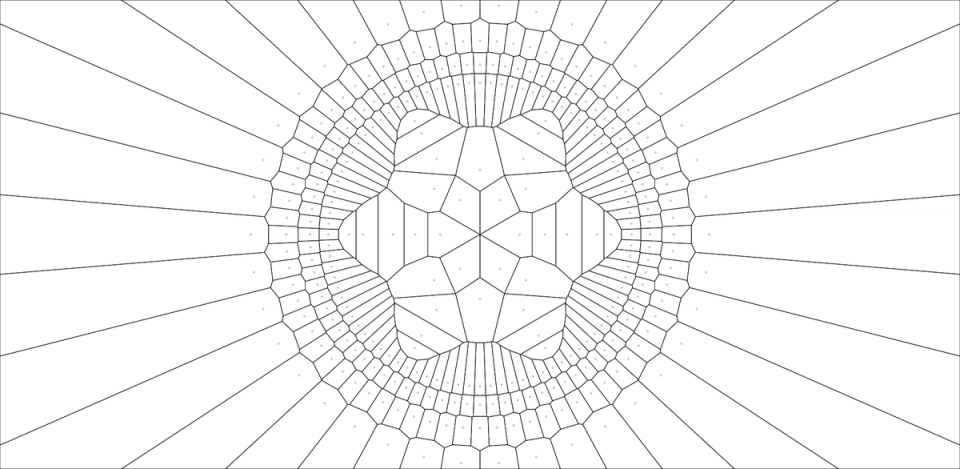
In the real world, organic membranes and interface layers (like skin) are formed when smaller, newly-divided cells are pushed towards the perimeter of an organism by internal pressure. Mathematically we can imagine that the number of cells in a ring increases and the change in ring diameter slightly decreases as a function of distance to the center of mass. If you use the right combination of prime numbers and exponential scaling, something really interesting happens:
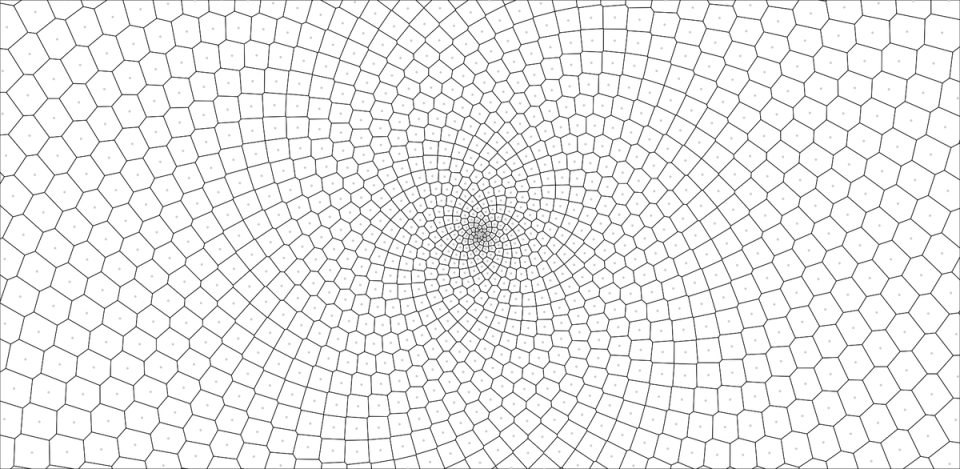
Arranging seed points using other patterns from nature, like phyllotaxis, also gives interesting results:
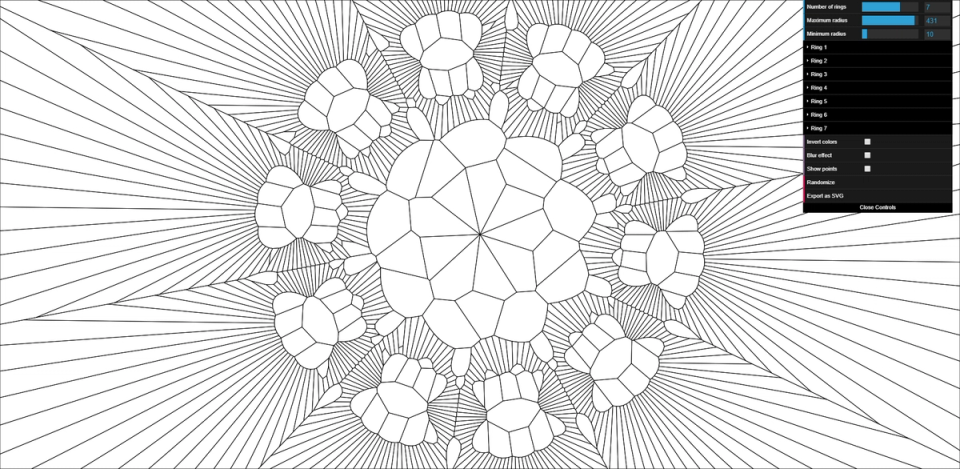
Playground UI
To make this series more widely useful to people, I created a configurable, parametric UI using dat.GUI that allows anyone to build fun, complex, and animated Voronoi diagrams without doing a lick of programming! I’ve made as many parameters configurable as I could think of, including the number of rings, ring diameter, points per ring, optional “sub-rings”, animation styles, and more.
If you own a pen plotter, laser cutter, or other CNC machine that can use line art, press E at any time to download an SVG file of the current geometry. This also works in any of the previous experiments!
Here’s a short demo of what is possible: